The Analysis tree shows the structure of the data and controls what sample or population is being acted on in every context.
The Analysis tree is composed of three sections:
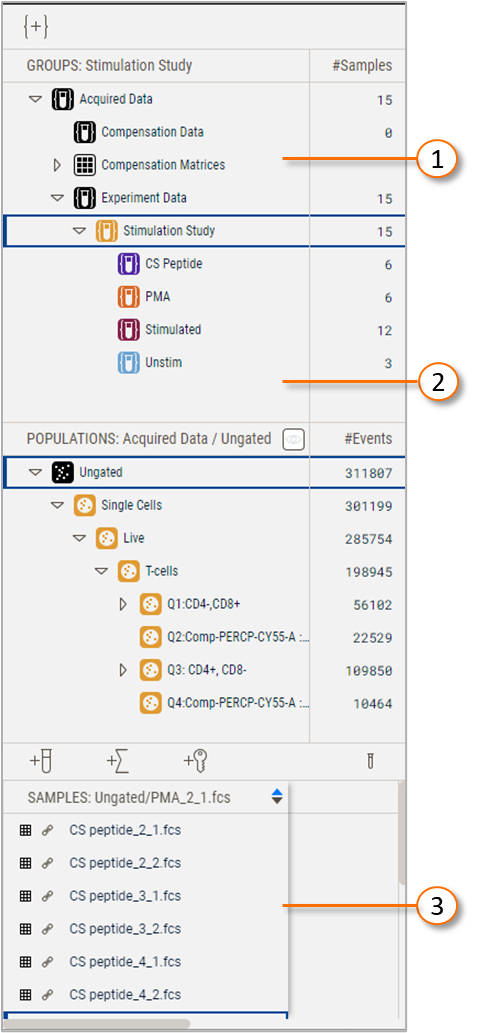
| No. | Description |
|---|---|
| 1 | Group panel |
| 2 | |
| 3 |
Figure 1 Illustration of the Analysis tree
Overview
The Group panel displays the organization of the experimental data in a hierarchical structure. Selecting a group filters the contents of the other two panels to the populations or samples associated with the group. All data files added to a workbench appear in the Acquired Data group. Data are then separated into the default child groups of Compensation Data or Experiment Data. You can then create subsequent child groups that further filter the samples.
As an example, in Figure 1 the group Stimulation Study is selected, so the populations Single Cells, Live, and T-cells are all displayed in the Populations panel because they were created on the Simulation Study group. Additionally, the populations Ungated, which is always the top level of any population hierarchy, and Good Events are displayed because the Stimulation Study populations are anchored to a group through these populations, which were created on the Experiment Data group.
NOTE: The color of the icon next to any population reveals which group it is associated with.
The hierarchical structure of groups in Version 11 allows you to organize your data like your experimental structure. The hierarchical approach allows for common populations to be created at a high level and propagated to all samples down the hierarchy, while creating unique or variable populations on specific branches of the overall study. In this example, the Single Cells, Live, and T-cell populations propagate down the hierarchy to all samples within the CS Peptide, PMA, and Unstim groups.
More information regarding the Group panel is available on the Group panel documentation page.
The Populations panel shows the common gating hierarchy of all samples in the group. Unlike previous versions of FlowJo one gating tree is shown at a time, determined by a combination of the group selected and the specific sample selected from the samples panel. We believe this greatly simplifies the display, allowing you to click on a sample and see the populations present without scrolling.
All populations are group owned. However, any population can be adjusted for a sample by modifying its graph. If a gate geometry is altered on a single sample, the text of that population becomes bolded. In Figure 2, the T-cell gate was modified for sample CS peptide_4_2, which is signified by the bolded text.
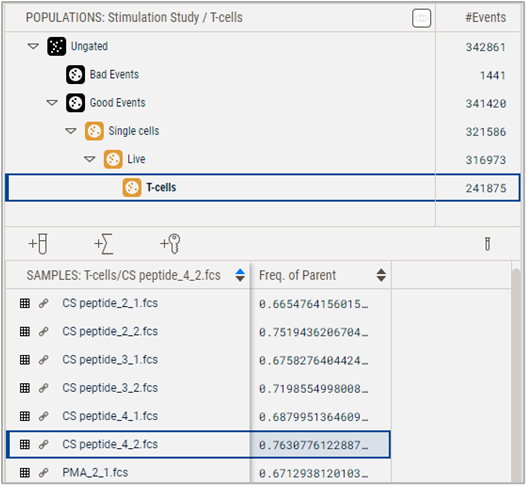
Figure 2 The T-cell population is bolded to indicate a modified gate
See-all mode displays all populations present on a selected sample, regardless of which group they are associated with. It is toggled on by clicking the eye icon in the header of the Populations panel. In this example Figure 3 shows that if See-all mode is toggled on, a TNF+ population appears for sample CS peptide_4_2 that was created only on the CD Peptide group, even though Stimulation Study is still the selected group. This population would be visible if the CS peptide group were selected or if See-all mode is on.
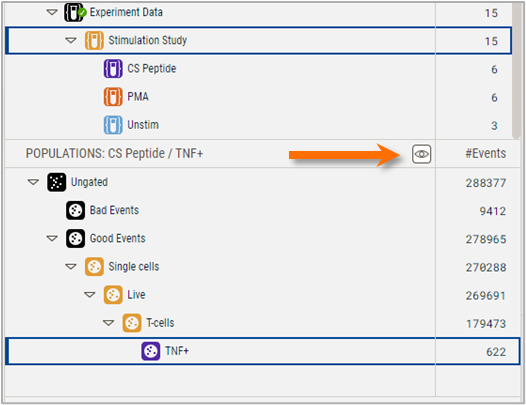
Figure 3 The toggle button for See-all mode
The Samples panel displays a list of the samples in the currently selected group. The grid to the left of a sample indicates whether the data are compensated/unmixed, with the color corresponding to the specific matrix, a list of which are present in the Compensation Matrices section of the Group panel. The link icon next to each sample displays the path to each sample if hovered over and will switch to a broken link icon if the file has been moved or deleted and cannot be found. You have the option to display any statistics or keywords in the samples panel by using the Add Statistics or Add Keywords tools displayed in Figure 4. The test tube icon button next to those two controls gives you the ability to Add Samples via a file menu.
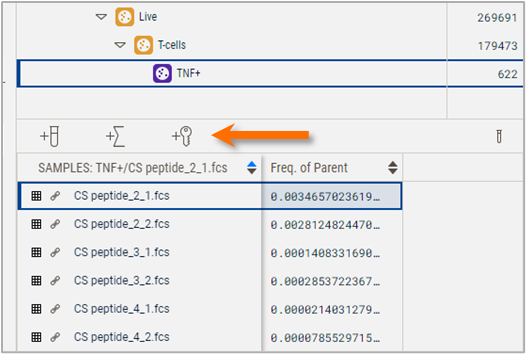
Figure 4 Add Statistics or Keywords to the Samples panel
More information regarding the Samples panel is available on the Samples panel documentation page.
Virtual Concatenation
The Samples panel, as well as the primary graph, contain toggles for virtually concatenating all the samples in a group. Virtual concatenation means that the samples are temporarily displayed as one combined file. This allows you to set gates on all samples at once, run an algorithm like t-SNE on all the samples in a group at one time without actually concatenating them into a single file, and other operations of the like. Clicking the "VCP" icon button at the top of the Samples panel will change the control to the 3-tube indicator, as shown in Figure 5.
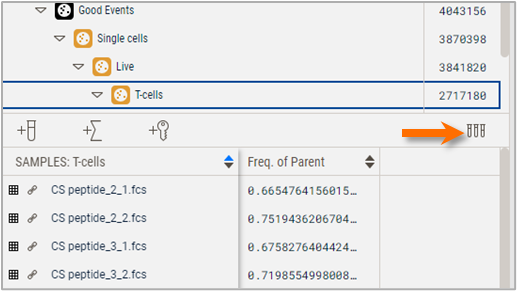
Figure 5 Virtual concatenation turned on
